WSO2 API-Manager -Monitoring (Prometheus + Grafana + Alerts)
This is an extension of the following article [1] which was written sometime back on integrating the WSO2 API-Manager with Prometheus. Certain concepts related to JMX monitoring used below are available in the previous article [1]. Therefore just take a quick peek at [1] before going through the following steps to understand some of the configurations.
The previous article was written based on a small effort done with WSO2 API-Manager 1.10.0. The API-Manager product has grown by leaps and bounds towards its latest release 3.2.0. Even Forrester Research Inc. has cited WSO2 as a Leader in the Forrester report in Q3,2020. You can read more about it from the following link [2].
In this article, let’s discuss how to integrate WSO2 API-Manager 3.2.0 with Prometheus/Grafana while including a sample alert to check any downtime of the API-Manager server. The alert will send an email to a specific recipient if the API-Manager server is not up and running.
Steps to integrating Prometheus with the WSO2 API-Manager server
- Create a YAML file (e.g. wso2config.yaml) with the following content and save it. The path to the file will be used in the configurations as described below.
startDelaySeconds: 30
jmxUrl: service:jmx:rmi://localhost:11111/jndi/rmi://localhost:9999/jmxrmi
ssl: false
lowercaseOutputName: true
username: admin
password: admin
2. Download the JMX exporter’s JAR from the following link [3].
3. Add the following line under $JAVA_VER_BASED_OPTS of the <APIM_HOME>/bin/wso2server.sh file. Please note the port given below (1234) which will be used to expose the JMX Mbeans via the Prometheus server as the /metrics endpoint.
-javaagent:<Path to the exporter’s JAR file>/jmx_prometheus_javaagent-0.15.0.jar=1234:<Path to the YAML config file>/wso2config.yaml \4. Download the main Prometheus server related to your Operating System from the following location [4] and unzip the file. Let’s name the path to the Prometheus Home directory as <PROM_HOME>.
5. Add a ‘targets’ entry as follows to the Prometheus server’s YAML file (<PROM_HOME>/prometheus.yml) directing to listen to the above port (1234) given for the JMX exporter.
scrape_configs:
  - job_name: 'prometheus'    static_configs:
    - targets: ['localhost:1234']
6. Start the Prometheus server. The command for the Linux distribution to be executed from <PROM_HOME> is as follows.
./prometheus --config.file=prometheus.yml7. Start the WSO2 API-Manager server as usual. The command for the Linux distribution to be executed from <APIM_HOME>/bin is as follows.
./wso2server.sh startOnce the above steps are completed you would be able to observe the above targets through the Prometheus console (http://localhost:9090/targets) as follows and the /metrics endpoint (http://localhost:1234/metrics) will also be accessible.

Further information on verifying the above integration is available in the previous article [1].
Steps to integrating Grafana to the above set up
- Download the Grafana server related to your Operating System from the following location [5] and unzip the file. Let’s name the path to the Grafana Home directory as <GRAFANA_HOME>.
- Start the Grafana server. The command for the Linux distribution to be executed from <GRAFANA_HOME>/bin is as follows.
./grafana-server3. Access the Grafana dashboard through the following URL. (Default credentials — admin:admin)
http://localhost:3000/4. Navigate to ‘Data Sources’ under ‘Configuration’ and the ‘Prometheus’ data source. Required configurations will be as follows.


Note: http://localhost:9090 is provided as the URL of the data source
5. Navigate to ‘Dashboards->Manage’ and import the JVM Dashboard available in [6] (via grafana.com). Instead of importing you can create your dashboard as well.

8563' dashboard6. You can change the name of the dashboard. I have given ‘WSO2 API Manager JVM dashboard’ as the name.

Note: ‘prometheus’ is provided as the ‘job’. This is the same job configured in the <PROM_HOME>/prometheus.yml file.
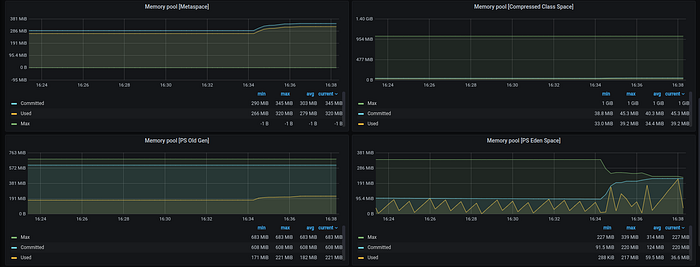
Once the dashboard is saved, it would be possible to monitor JVM information (including heap memory, GC) through the available panels. The Uptime status will also be visible. Please refer to the following screenshots.


Steps to implementing an alert
Prometheus facilitates alerting rules [7]which can be incorporated with its AlertManager [8] in order to route them to the correct receiver through channels such as email, PagerDuty.
Alerting rules can be defined to alert cases like high CPU, high memory, increased response time and even more advanced alerts.
In this article, let’s look into a simple alert that checks if the API-Manager server is up and running. This can be monitored from the Prometheus console with the simple ‘up’ expression.

As shown above, the ‘up’ expression would return ‘1’ if the target defined in the <PROM_HOME>/prometheus.yml file is available and if not it will return ‘0’. Let’s use this as our expression to generate the alert.
The below steps explain a simple alert that can be implemented to notify if the WSO2 API-Manager server has been shut down or if there are any issues in responding.
- Create a file named ‘prometheus_rules.yml’ inside the <PROM_HOME> directory.
- Define an alerting rule as follows for the Prometheus server in the <PROM_HOME>/prometheus_rules.yml file. Note the ‘expr’ property to check the status of the target including the WSO2 API-Manager.
groups:
- name: WSO2
  rules:
  - alert: APIManagerTargetMissing
    expr: up == 0
    for: 0m
    labels:
      severity: critical
    annotations:
      description: WSO2 API-Manager Prometheus target is missing
3. Update the <PROM_HOME>/prometheus.yml file to include the above ‘prometheus_rules.yml’ file under the ‘rule_files’ sections. Let’s look into the ‘Alertmanager configuration’ later.
# Alertmanager configuration
alerting:
  alertmanagers:
  - static_configs:
    - targets:
      - localhost:9093# Load rules once and periodically evaluate them according to the global 'evaluation_interval'.
rule_files:
  - "prometheus_rules.yml"
4. Once the Prometheus server is restarted, you will be able to notice the defined alert from the Prometheus console (http://localhost:9090/alerts) as follows.

5. Now shut down or kill the WSO2 API-Manager server process. The alert will start firing as shown below. The Grafana dashboard will also indicate that the server is down.


Steps to integrating the Prometheus AlertManager.
- Download the AlertManager server related to your Operating System from the following location [9] and unzip the file. Let’s name the path to the Grafana Home directory as <ALM_HOME>.
- Create a file named ‘alertmanager.yml’ inside the <ALM_HOME> directory with the following content and save the file.
global:
  resolve_timeout: 5mroute:
  group_by: ['alertname']
  group_wait: 10s
  group_interval: 10s
  repeat_interval: 15m
  receiver: 'email'
receivers:
- name: 'email'
  email_configs:
  - to: test@wso2.com
    from: testmail@gmail.com
    smarthost: smtp.gmail.com:587
    auth_username: "testmail@gmail.com"
    auth_identity: "testmail@gmail.com"
    auth_password: "testmailpassword"
inhibit_rules:
  - source_match:
      severity: 'critical'
    target_match:
      severity: 'warning'
    equal: ['alertname', 'dev', 'instance']
Note: The above AlertManager configurations are used to send an email to the email address defined under the ‘to’ element. Further details on the configurations are available in [10]. I have used Gmail SMTP above and it’s required to enable “Less Secure Apps” in Gmail to use the SMTP.
3. Start the AlertManager. The command for the Linux distribution to be executed from <ALM_HOME> is as follows.
./alertmanager --config.file=alertmanager.yml4. The configuration defined above in <PROM_HOME>/prometheus.yml file refers to the Prometheus AlertManager (localhost:9093).
# Alertmanager configuration
alerting:
  alertmanagers:
  - static_configs:
    - targets:
      - localhost:9093
5. You can access the AlertManager console through the following URL.
http://localhost:9093/#/alerts6. If the Prometheus server is firing alerts due to the unavailability of the WSO2 API-Manager server, the AlertManager will capture the alerts.

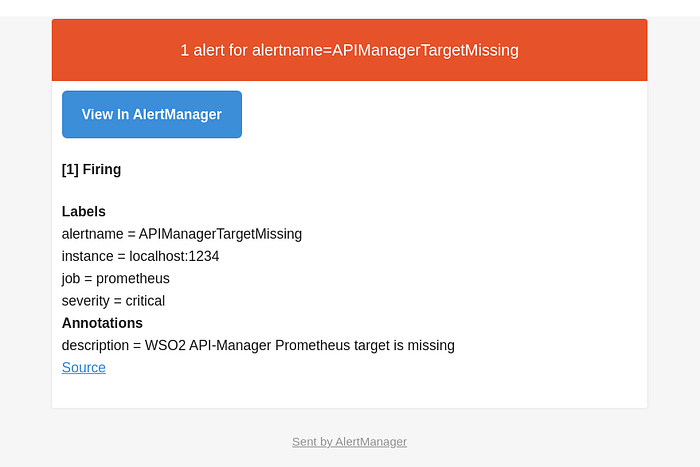
7. And as per the configurations provided in <ALM_HOME>/alertmanager.yml an email will be sent to the recipient as follows. As per the above configurations, this alert will be sent every 15 minutes until the WSO2 API-Manager server comes to an up and running state.

Have a look at the above configurations and the following links to implement a set of impressive alerts that would be helpful in monitoring certain deployments. You can look into alerts such as pager duty, Opsgenie, VictorOps as well.
Also, the Prometheus/Grafana products can be installed using various approaches and the above steps refer to a few of them which I find to be easy. Depending on the deployment, you can use containerized installations as well.
Cheers.
[1]. https://lashan.medium.com/monitoring-wso2-products-with-prometheus-4ace34759901
[2]. https://wso2.com/resources/analyst-reports/the-forrester-wave-api-management-solutions-q3-2020/
[3]. https://github.com/prometheus/jmx_exporter
[4]. https://prometheus.io/download/
[5]. https://grafana.com/grafana/download
[6]. https://grafana.com/grafana/dashboards/8563
[7]. https://prometheus.io/docs/prometheus/latest/configuration/alerting_rules/
[8]. https://prometheus.io/docs/alerting/latest/alertmanager/
[9]. https://github.com/prometheus/alertmanager/releases
[10]. https://prometheus.io/docs/alerting/latest/configuration/#email_config

